P1]
For many, Microsoft Excel conjures images of spreadsheets filled with numbers, formulas, and basic charts. While it excels at these fundamental tasks, its capabilities extend far beyond simple data entry and calculation. In fact, Excel, when used strategically, can be a powerful Business Intelligence (BI) tool, empowering users to analyze data, uncover insights, and make data-driven decisions. This article will explore how Excel can be leveraged as a BI solution, highlighting its strengths, limitations, and practical applications.
Excel: More Than Just Spreadsheets
The perception of Excel as a mere spreadsheet program often overshadows its robust features that cater to data analysis and reporting. Here’s a glimpse into how Excel transforms from a simple tool to a potent BI asset:
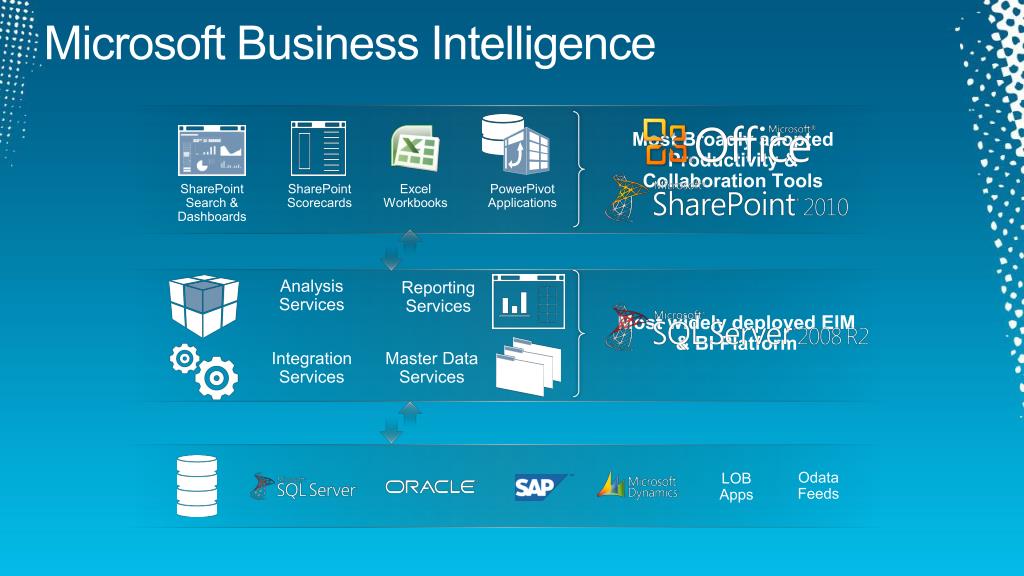
- Data Connectivity: Excel can connect to a wide variety of data sources, including databases (SQL Server, Access, Oracle), cloud services (Azure, Salesforce), and even text files. This eliminates the need for manual data entry and ensures data is up-to-date and accurate.
- Data Transformation and Cleaning (Power Query): Power Query, formerly known as "Get & Transform Data," is a powerful data manipulation tool integrated directly into Excel. It allows users to clean, transform, and reshape data from various sources, ensuring consistency and accuracy before analysis. Features include filtering, sorting, removing duplicates, splitting columns, merging data, and much more.
- Data Modeling (Power Pivot): Power Pivot allows users to create data models within Excel, establishing relationships between different tables and creating calculated columns and measures using DAX (Data Analysis Expressions). This enables complex analysis and reporting on interconnected datasets, surpassing the limitations of traditional spreadsheets.
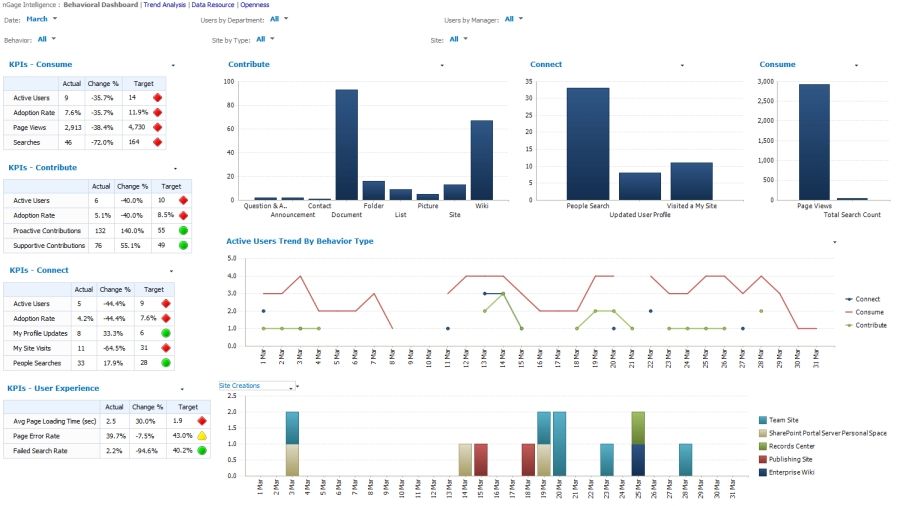
- Data Visualization: Excel offers a wide range of chart types, including bar charts, line charts, pie charts, scatter plots, and more. These visuals help users understand data trends, identify outliers, and communicate insights effectively. Furthermore, features like conditional formatting and sparklines allow for highlighting key data points and patterns within the spreadsheet itself.
- Analysis and Reporting: Excel provides various analytical functions and tools, including pivot tables, slicers, and timelines, which allow users to summarize, filter, and analyze data from different perspectives. These tools enable the creation of interactive dashboards and reports that can be easily shared with stakeholders.
- Collaboration and Sharing: Excel files can be easily shared with colleagues and collaborators, facilitating teamwork and knowledge sharing. Features like comments and track changes allow for collaborative editing and version control.
Leveraging Excel for Business Intelligence: Practical Applications
The capabilities outlined above allow Excel to be used in a variety of BI applications across different industries. Here are some examples:
- Sales Performance Analysis: Connecting to sales data from a CRM system, Excel can be used to track sales performance by region, product, or salesperson. Power Pivot can be used to create a data model that relates sales data to customer data, allowing for analysis of customer demographics and purchasing behavior. Visualizations like bar charts and line charts can illustrate sales trends and identify top-performing products or regions.
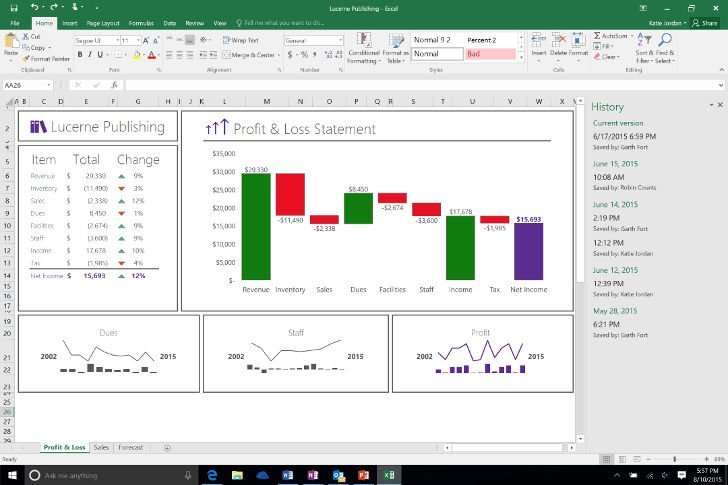
- Financial Reporting: Excel can be used to create financial reports, such as income statements, balance sheets, and cash flow statements. Data can be imported from accounting software and transformed using Power Query. Power Pivot can be used to create calculated ratios and metrics, providing a deeper understanding of financial performance.
- Inventory Management: Excel can be used to track inventory levels, monitor stock turnover, and identify slow-moving items. Data can be imported from inventory management systems and analyzed using pivot tables and charts. This can help businesses optimize inventory levels and reduce costs.
- Marketing Campaign Analysis: Excel can be used to analyze the effectiveness of marketing campaigns by tracking key metrics such as website traffic, lead generation, and conversion rates. Data can be imported from marketing automation platforms and analyzed using pivot tables and charts. This can help businesses optimize their marketing campaigns and improve ROI.
- Project Management: Excel can be used to track project progress, monitor budgets, and manage resources. Data can be entered manually or imported from project management software. Gantt charts and other visualizations can be used to track project timelines and identify potential delays.
- Human Resources Analytics: Excel can be used to analyze employee data, such as demographics, performance, and turnover rates. Data can be imported from HR systems and analyzed using pivot tables and charts. This can help businesses identify trends, improve employee retention, and optimize workforce planning.
The Power of Power Query and Power Pivot: A Deeper Dive
Understanding Power Query and Power Pivot is crucial for maximizing Excel’s BI potential.
Power Query:
- Data Source Flexibility: Connects to a vast array of data sources, including relational databases, web APIs, cloud storage, and more.
- Data Transformation Language (M): Uses the "M" language to define data transformation steps, providing a powerful and flexible way to manipulate data.
- Repeatable Transformations: Saves data transformation steps, allowing for automated data refresh and consistent data cleaning.
- Error Handling: Provides tools for identifying and resolving data quality issues.
- Example: Imagine you have sales data in multiple CSV files with inconsistent formatting. Power Query can connect to each file, standardize the date format, clean up inconsistent product names, and merge the data into a single, clean table ready for analysis.
Power Pivot:
- In-Memory Analytical Engine: Leverages an in-memory engine for fast data processing, even with large datasets.
- Data Modeling Capabilities: Allows you to create relationships between tables, creating a relational data model within Excel.
- DAX (Data Analysis Expressions): Enables you to create calculated columns and measures, performing complex calculations across related tables.
- Example: You have sales data in one table and customer data in another. Power Pivot allows you to create a relationship between the two tables based on a shared customer ID. You can then use DAX to calculate the average purchase amount per customer, even though the sales data and customer data reside in separate tables.
Limitations of Excel as a BI Tool
While Excel offers significant BI capabilities, it’s important to acknowledge its limitations:
- Scalability: Excel can struggle with extremely large datasets. While Power Pivot improves performance, it still has limitations compared to dedicated BI platforms.
- Collaboration: While sharing is possible, Excel lacks the robust collaboration features of dedicated BI platforms like version control, real-time co-authoring, and centralized data governance.
- Security: Securing sensitive data in Excel can be challenging. While password protection is available, it’s not as robust as the security features offered by enterprise-grade BI solutions.
- Automation: While Power Query allows for some automation, creating complex, automated workflows can be challenging compared to dedicated ETL (Extract, Transform, Load) tools.
- Complex Reporting: While Excel offers a variety of chart types, creating highly customized and interactive dashboards can be limited compared to dedicated BI platforms.
- Data Governance: Maintaining data consistency and accuracy across multiple Excel files can be difficult without proper data governance policies.
When is Excel a Good Choice for BI?
Excel is a suitable BI tool for:
- Small to medium-sized businesses: Where the volume of data is manageable and the budget is limited.
- Individual users: Who need to analyze data and create reports for their own use.
- Departments within larger organizations: That need to perform ad-hoc analysis and create custom reports.
- Prototyping and Proof-of-Concept: Before investing in a more expensive and complex BI platform.
- Users already familiar with Excel: The learning curve is relatively low for users already proficient in Excel.
When to Consider a Dedicated BI Platform:
Consider a dedicated BI platform like Power BI, Tableau, or Qlik Sense when:
- Dealing with very large datasets: That exceed Excel’s processing capabilities.
- Requiring advanced data visualization and interactive dashboards: Beyond what Excel can offer.
- Needing robust collaboration and data governance features: For team-based analysis and data management.
- Demanding enterprise-level security: To protect sensitive data.
- Automating complex data workflows: Requiring advanced ETL capabilities.
Conclusion
Microsoft Excel, equipped with Power Query and Power Pivot, is a surprisingly powerful Business Intelligence tool. It provides a cost-effective and accessible solution for data analysis, reporting, and visualization, particularly for smaller businesses and individual users. While it has limitations in scalability, collaboration, and security compared to dedicated BI platforms, it remains a valuable asset for extracting insights from data and making informed decisions. By understanding its strengths and limitations, businesses can effectively leverage Excel to unlock the power within their data and gain a competitive edge. Choosing between Excel and a dedicated BI platform depends on the specific needs and resources of the organization. In many cases, Excel can serve as a stepping stone towards a more sophisticated BI solution.
FAQ
Q: What is DAX?
A: DAX (Data Analysis Expressions) is a formula language used in Power Pivot, Power BI, and SQL Server Analysis Services. It allows you to create calculated columns and measures, performing complex calculations across related tables in your data model.
Q: How do I install Power Query and Power Pivot?
A: Power Query is built into Excel 2016 and later versions. For earlier versions (Excel 2010 and 2013), it can be downloaded as a free add-in from Microsoft. Power Pivot is also available as an add-in for Excel 2010 and later versions. You need to enable it in the Excel options.
Q: Can I use Excel for real-time data analysis?
A: While Excel can connect to real-time data sources, it’s not ideal for continuous, high-volume real-time analysis. Dedicated BI platforms are better suited for this purpose.
Q: Is Excel a substitute for a data warehouse?
A: No. A data warehouse is a centralized repository for storing and managing large volumes of data from various sources. Excel can connect to a data warehouse, but it cannot replace its core functionality.
Q: How can I improve the performance of Excel when working with large datasets?
A: Use Power Pivot, optimize your data model, avoid volatile functions, and close unnecessary applications.
Q: What are some good resources for learning more about Excel BI?
A: Microsoft’s official documentation, online courses on platforms like Udemy and Coursera, and books dedicated to Excel Power Query and Power Pivot are excellent resources.
Q: Can I automate report generation in Excel?
A: Yes, using VBA (Visual Basic for Applications) or by combining Power Query with data refresh schedules.
Q: How secure is Excel for storing sensitive data?
A: Excel’s security features are limited. Consider using password protection, encrypting the file, and implementing access controls. For highly sensitive data, a dedicated BI platform with robust security features is recommended.
Q: Can I share Excel dashboards with users who don’t have Excel?
A: Yes, you can save the dashboard as a PDF or use Excel Online, which allows users to view and interact with the dashboard in a web browser. However, interactive features may be limited in these formats.

Leave a Reply