P1]
In today’s data-driven world, the ability to understand and communicate complex information is paramount. Tableau, a leading data visualization software, empowers individuals and organizations to do just that. It transforms raw data into interactive, insightful dashboards and reports, enabling users to discover patterns, trends, and anomalies that would otherwise remain hidden. This article will delve into the core features, benefits, and use cases of Tableau, exploring how it can revolutionize the way you interact with your data.
What is Tableau?
Tableau is a business intelligence and data visualization software that allows users to connect to a wide range of data sources, including spreadsheets, databases, and cloud services. It provides a user-friendly interface for creating interactive dashboards, reports, and visualizations without requiring extensive coding knowledge. Tableau’s drag-and-drop functionality makes it easy to explore data, identify trends, and communicate insights effectively.
Key Features and Capabilities:
Tableau offers a comprehensive suite of features designed to facilitate data exploration and visualization:
Data Connectivity: Tableau can connect to a vast array of data sources, including:
- Databases: SQL Server, Oracle, MySQL, PostgreSQL, Amazon Redshift, Google BigQuery, and many more.
- Cloud Services: Amazon S3, Google Cloud Storage, Microsoft Azure Blob Storage.
- Spreadsheets: Microsoft Excel, CSV files, Google Sheets.
- Other Data Sources: Salesforce, Hadoop, JSON, XML, and even web data via APIs.
Drag-and-Drop Interface: Tableau’s intuitive drag-and-drop interface allows users to quickly create visualizations by simply dragging data fields onto the canvas. This eliminates the need for complex coding or scripting, making it accessible to users of all skill levels.
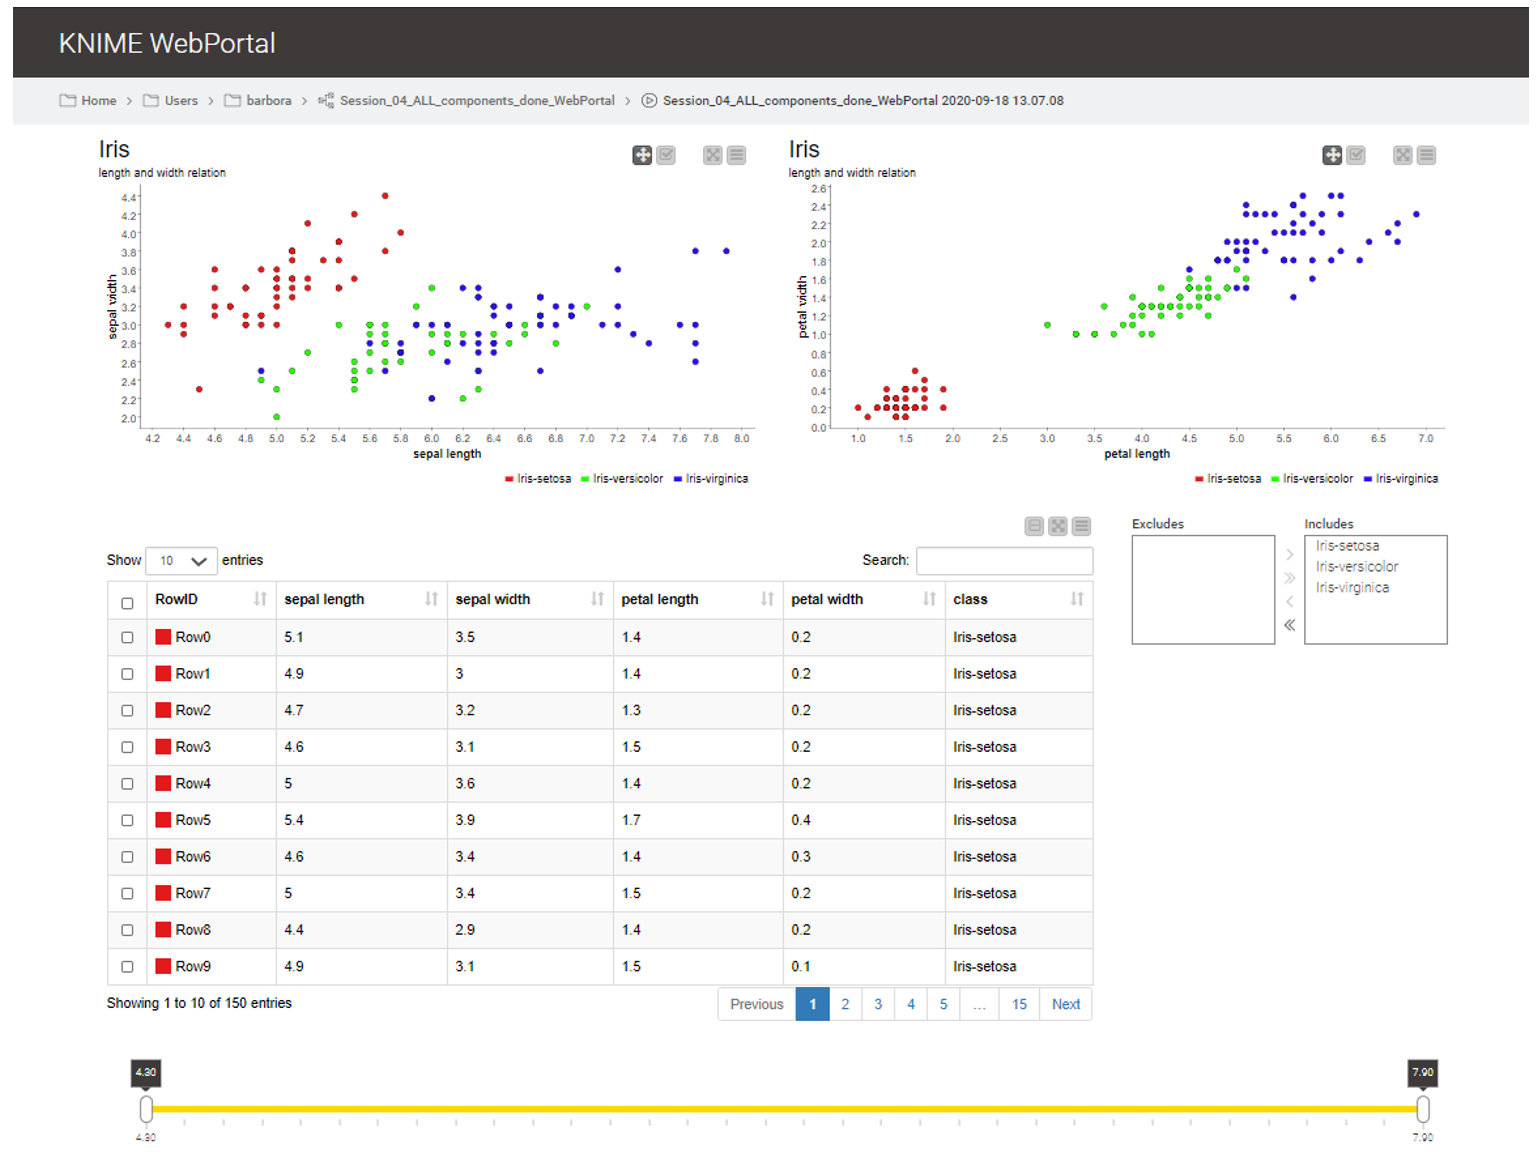
Interactive Dashboards: Tableau dashboards are highly interactive, allowing users to filter, sort, and drill down into data to explore different perspectives. This interactivity enables users to uncover hidden patterns and gain deeper insights.

Data Blending: Tableau’s data blending feature allows users to combine data from multiple sources, even if they don’t share a common key. This enables users to create comprehensive analyses that draw on data from various systems.
Mapping Capabilities: Tableau provides robust mapping capabilities, allowing users to visualize data geographically. This is particularly useful for analyzing location-based data, such as sales territories, customer demographics, or environmental factors.
Calculated Fields: Tableau allows users to create calculated fields using formulas and expressions. This enables users to perform complex calculations on their data, such as calculating profit margins, growth rates, or moving averages.
Advanced Analytics: Tableau offers a range of advanced analytics features, including:
- Trend Lines: Identify trends in your data with linear, exponential, and logarithmic trend lines.
- Forecasting: Predict future values based on historical data using statistical forecasting models.
- Clustering: Group similar data points together based on their characteristics.
- Statistical Analysis: Perform statistical tests, such as t-tests and ANOVA, to analyze the significance of your data.
Mobile Accessibility: Tableau dashboards can be accessed on mobile devices, allowing users to stay informed and make data-driven decisions on the go.
Collaboration and Sharing: Tableau allows users to easily share their dashboards and reports with colleagues and stakeholders. This fosters collaboration and ensures that everyone is working with the same information.
Tableau Prep: A separate tool within the Tableau ecosystem, Tableau Prep helps users clean, shape, and prepare their data for analysis. It provides a visual interface for performing data transformations, such as filtering, joining, and aggregating data.

Benefits of Using Tableau:
Implementing Tableau offers numerous benefits for individuals and organizations:
Improved Data Understanding: Tableau’s visual interface makes it easier to understand complex data and identify patterns that would otherwise be missed.
Faster Decision Making: By providing real-time insights, Tableau empowers users to make faster and more informed decisions.
Enhanced Collaboration: Tableau’s collaboration features enable teams to share insights and work together more effectively.
Increased Efficiency: Tableau automates many of the manual tasks associated with data analysis, freeing up time for users to focus on more strategic initiatives.
Reduced Costs: By streamlining data analysis and reporting, Tableau can help organizations reduce costs associated with data management and decision-making.
Data-Driven Culture: Tableau fosters a data-driven culture by making data accessible and understandable to everyone in the organization.
Use Cases of Tableau:
Tableau can be used in a wide range of industries and applications:
Sales and Marketing: Track sales performance, analyze customer demographics, and optimize marketing campaigns.
Finance: Monitor financial performance, identify trends in revenue and expenses, and forecast future financial results.
Operations: Optimize supply chain operations, improve efficiency, and reduce costs.
Healthcare: Analyze patient data, track disease outbreaks, and improve patient outcomes.
Education: Analyze student performance, track enrollment trends, and improve educational outcomes.
Human Resources: Track employee performance, analyze employee demographics, and improve employee engagement.
Tableau Products:
Tableau offers a variety of products to meet the needs of different users and organizations:
- Tableau Desktop: The core product for creating and publishing visualizations and dashboards.
- Tableau Prep Builder: A data preparation tool for cleaning and shaping data.
- Tableau Server: A platform for sharing and collaborating on Tableau workbooks within an organization.
- Tableau Online: A cloud-based version of Tableau Server.
- Tableau Public: A free platform for creating and sharing visualizations publicly.
- Tableau Reader: A free application for viewing Tableau workbooks.
Getting Started with Tableau:
Getting started with Tableau is relatively straightforward:
- Download and Install Tableau Desktop: Download a free trial of Tableau Desktop from the Tableau website.
- Connect to Your Data: Connect to your desired data source using Tableau’s data connectors.
- Explore Your Data: Drag and drop data fields onto the canvas to create visualizations.
- Create a Dashboard: Combine multiple visualizations into a dashboard to tell a compelling story with your data.
- Share Your Work: Publish your dashboard to Tableau Server or Tableau Online to share it with others.
Learning Resources:
Tableau offers a wealth of learning resources to help users get up to speed:
- Tableau Training: Tableau offers both online and in-person training courses.
- Tableau Help Documentation: Comprehensive documentation covering all aspects of Tableau.
- Tableau Community Forums: A vibrant online community where users can ask questions and share knowledge.
- Tableau Blogs and Tutorials: Numerous blogs and tutorials available online that provide step-by-step instructions on how to use Tableau.
Pricing:
Tableau offers various pricing options, including subscriptions for individuals, teams, and organizations. Pricing varies depending on the features and functionality required. It’s best to check the official Tableau website for the most up-to-date pricing information.
FAQ (Frequently Asked Questions):
Q: What is the difference between Tableau Desktop and Tableau Server?
- A: Tableau Desktop is used for creating and developing visualizations and dashboards. Tableau Server is a platform for sharing and collaborating on those visualizations within an organization. Think of Desktop as the creation tool, and Server as the distribution and collaboration platform.
Q: Is Tableau easy to learn?
- A: Tableau is known for its user-friendly drag-and-drop interface, making it relatively easy to learn, especially for those with some familiarity with data analysis. However, mastering advanced features and complex calculations requires dedicated learning and practice.
Q: What types of data sources can Tableau connect to?
- A: Tableau can connect to a wide variety of data sources, including databases (SQL Server, Oracle, MySQL), cloud services (Amazon S3, Google Cloud Storage), spreadsheets (Excel, CSV), and more.
Q: Can I use Tableau for free?
- A: Tableau offers a free version called Tableau Public, which allows you to create and share visualizations publicly. There’s also a free trial of Tableau Desktop available for a limited time.
Q: Does Tableau require coding?
- A: While Tableau doesn’t require extensive coding knowledge for basic visualizations, you can use calculated fields with formulas and expressions to perform more complex analysis. Also, connecting to some data sources might require some SQL knowledge.
Q: What is Tableau Prep Builder used for?
- A: Tableau Prep Builder is a data preparation tool used for cleaning, shaping, and preparing data for analysis in Tableau Desktop. It helps to transform raw data into a usable format.
Q: How do I share my Tableau dashboards with others?
- A: You can share your Tableau dashboards by publishing them to Tableau Server, Tableau Online, or Tableau Public. You can also export them as static images or PDFs.
Q: Is Tableau suitable for large datasets?
- A: Yes, Tableau is designed to handle large datasets efficiently. It uses in-memory processing and data extracts to optimize performance.
Q: What are the alternatives to Tableau?
- A: Some alternatives to Tableau include Power BI, Qlik Sense, Looker, and Google Data Studio. Each tool has its strengths and weaknesses, so the best choice depends on your specific needs and requirements.
Conclusion:
Tableau is a powerful and versatile data visualization tool that empowers individuals and organizations to unlock the hidden potential of their data. Its intuitive interface, comprehensive features, and robust data connectivity make it an invaluable asset for anyone looking to gain deeper insights, make better decisions, and drive business success. Whether you’re a seasoned data analyst or just starting your data journey, Tableau offers the tools and resources you need to transform raw data into actionable intelligence. By embracing Tableau, you can unlock the power of visual data exploration and gain a competitive edge in today’s data-driven world.


Leave a Reply