P1]
In the dynamic world of business, staying ahead requires more than just strategic vision. It demands a granular understanding of day-to-day operations, and that’s where operational reporting comes into play. Operational reporting acts as a critical compass, guiding businesses through the complex landscape of data, providing actionable insights to optimize processes, improve efficiency, and ultimately, achieve strategic goals. This article delves into the intricacies of operational reporting, exploring its purpose, key components, benefits, challenges, and best practices, equipping you with the knowledge to leverage its power effectively.
What is Operational Reporting?
Operational reporting is the process of collecting, analyzing, and presenting data related to an organization’s core day-to-day activities. Unlike strategic reports that focus on long-term trends and overall performance, operational reports provide a real-time or near real-time snapshot of what’s happening on the ground. They are designed to monitor performance against pre-defined metrics, identify bottlenecks, highlight areas for improvement, and enable immediate action.
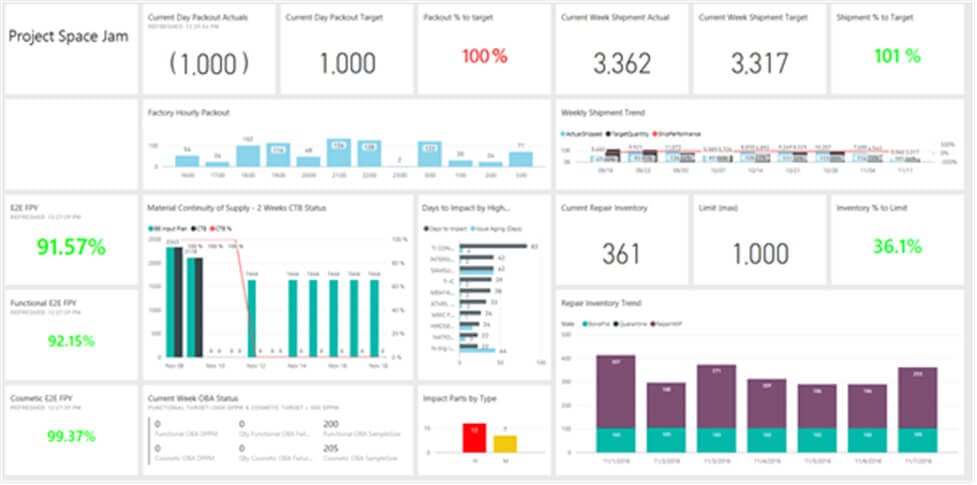
Think of it as the dashboard of a complex machine. It displays critical indicators like speed, pressure, and temperature, allowing the operator to make adjustments and ensure optimal performance. In a business context, these indicators could be sales figures, production output, customer service response times, or inventory levels.
Key Components of Effective Operational Reporting:
A robust operational reporting system comprises several key components that work together to deliver valuable insights:
Data Sources: The foundation of any operational report is the data itself. This data can come from a variety of sources, including:
- Enterprise Resource Planning (ERP) Systems: Providing data on finance, manufacturing, supply chain, and human resources.
- Customer Relationship Management (CRM) Systems: Tracking customer interactions, sales pipelines, and marketing campaigns.
- Manufacturing Execution Systems (MES): Monitoring production processes, equipment performance, and quality control.
- Web Analytics Platforms: Capturing website traffic, user behavior, and conversion rates.
- Point-of-Sale (POS) Systems: Recording sales transactions, inventory levels, and customer demographics.
- Custom Databases: Storing data specific to the organization’s unique operations.


Key Performance Indicators (KPIs): KPIs are quantifiable metrics that measure the performance of specific operational activities. They should be aligned with the organization’s strategic goals and provide a clear indication of progress. Examples include:
- Sales Conversion Rate: Measures the percentage of leads that convert into paying customers.
- Order Fulfillment Time: Tracks the time it takes to process and deliver an order.
- Customer Satisfaction Score (CSAT): Measures customer satisfaction with products or services.
- Production Downtime: Tracks the amount of time production processes are interrupted due to equipment failure or other issues.
- Inventory Turnover Rate: Measures how quickly inventory is sold and replaced.
Reporting Tools: These tools are used to extract, transform, and load (ETL) data from various sources, analyze it, and present it in a user-friendly format. Common reporting tools include:
- Spreadsheet Software (e.g., Microsoft Excel, Google Sheets): Suitable for basic reporting and analysis.
- Business Intelligence (BI) Platforms (e.g., Tableau, Power BI, Qlik): Offer advanced data visualization, analysis, and reporting capabilities.
- Custom Reporting Applications: Developed specifically to meet the organization’s unique reporting needs.
Reporting Frequency: The frequency of operational reports should be determined by the nature of the operations being monitored and the speed at which decisions need to be made. Reports can be generated daily, weekly, monthly, or even in real-time.
Report Distribution: Reports should be distributed to the relevant stakeholders in a timely and efficient manner. This can be done through email, online dashboards, or printed reports.

Benefits of Implementing Operational Reporting:
Implementing a robust operational reporting system offers a multitude of benefits:
- Improved Decision-Making: Provides real-time insights that enable managers to make informed decisions quickly and effectively.
- Enhanced Efficiency: Identifies bottlenecks and inefficiencies in operational processes, allowing for targeted improvements.
- Increased Productivity: By monitoring performance against KPIs, operational reporting helps to motivate employees and drive productivity.
- Reduced Costs: By identifying areas of waste and inefficiency, operational reporting helps to reduce costs and improve profitability.
- Improved Customer Satisfaction: By monitoring customer service metrics and identifying areas for improvement, operational reporting helps to improve customer satisfaction and loyalty.
- Proactive Problem Solving: Allows for the early detection of potential problems, enabling proactive intervention and preventing costly disruptions.
- Better Resource Allocation: Provides insights into resource utilization, allowing for more efficient allocation of resources.
- Compliance and Regulatory Reporting: Facilitates compliance with regulatory requirements by providing accurate and timely data.
Challenges of Implementing Operational Reporting:
Despite its numerous benefits, implementing operational reporting can present several challenges:
- Data Silos: Data may be scattered across different systems and departments, making it difficult to consolidate and analyze.
- Data Quality Issues: Inaccurate or incomplete data can lead to misleading insights and poor decision-making.
- Lack of Technical Skills: Developing and maintaining an operational reporting system requires technical expertise in data extraction, analysis, and visualization.
- Resistance to Change: Employees may be resistant to using new reporting systems or changing their work processes.
- Defining Relevant KPIs: Identifying the right KPIs to track can be challenging, especially if the organization’s strategic goals are not clearly defined.
- Overwhelming Data: The sheer volume of data available can be overwhelming, making it difficult to identify meaningful insights.
- Cost of Implementation: Implementing an operational reporting system can be expensive, especially if it requires significant investment in software and hardware.
Best Practices for Effective Operational Reporting:
To overcome these challenges and maximize the benefits of operational reporting, consider the following best practices:
- Define Clear Objectives: Clearly define the goals of the operational reporting system and identify the KPIs that will be used to measure progress.
- Ensure Data Quality: Implement processes to ensure the accuracy and completeness of data.
- Invest in Training: Provide employees with the necessary training to use the reporting system effectively.
- Promote a Data-Driven Culture: Encourage employees to use data to inform their decisions and improve their performance.
- Automate Reporting Processes: Automate data extraction, analysis, and report generation to reduce manual effort and improve efficiency.
- Use Data Visualization: Use charts and graphs to present data in a clear and concise manner.
- Regularly Review and Update Reports: Regularly review reports to ensure they are still relevant and provide valuable insights.
- Integrate Data Sources: Break down data silos by integrating data from different systems and departments.
- Start Small and Scale Up: Begin with a pilot project to test the reporting system and gradually scale it up to cover other areas of the organization.
- Seek Executive Sponsorship: Secure executive sponsorship to ensure the project receives the necessary resources and support.
Operational Reporting vs. Strategic Reporting:
It’s crucial to differentiate operational reporting from strategic reporting. While both provide valuable insights, they serve different purposes and target different audiences.
| Feature | Operational Reporting | Strategic Reporting |
|---|---|---|
| Focus | Day-to-day operations, immediate action | Long-term trends, overall performance |
| Time Horizon | Real-time or near real-time | Quarterly, annual, or multi-year |
| Audience | Managers, supervisors, operational staff | Executives, board of directors, investors |
| Purpose | Improve efficiency, identify bottlenecks, solve problems | Track progress towards strategic goals, inform investment decisions |
| Data Granularity | Highly detailed, granular data | Aggregated data, summary trends |
Conclusion:
Operational reporting is a powerful tool for driving efficiency, improving decision-making, and ultimately achieving strategic goals. By understanding its key components, benefits, challenges, and best practices, organizations can leverage its power to gain a competitive advantage in today’s dynamic business environment. Embracing a data-driven culture and investing in the right tools and training are essential for successful implementation. Remember, operational reporting is not just about generating reports; it’s about using data to drive actionable insights and create a culture of continuous improvement.
Frequently Asked Questions (FAQ):
Q: What is the difference between a report and a dashboard?
A: A report is typically a static document that presents data in a predefined format. A dashboard, on the other hand, is a dynamic and interactive interface that provides a real-time view of key performance indicators.
Q: How do I choose the right KPIs for operational reporting?
A: The KPIs you choose should be aligned with your organization’s strategic goals and reflect the key drivers of performance in your operational areas. Consider what metrics will provide the most actionable insights and help you identify areas for improvement.
Q: How often should I generate operational reports?
A: The frequency of reports depends on the nature of the operations being monitored and the speed at which decisions need to be made. Daily or weekly reports are common for fast-paced operations, while monthly reports may be sufficient for more stable processes.
Q: What are some common mistakes to avoid when implementing operational reporting?
A: Common mistakes include neglecting data quality, failing to define clear objectives, using irrelevant KPIs, and failing to provide adequate training to employees.
Q: How can I improve data quality for operational reporting?
A: Implement data validation rules, regularly audit data for accuracy, and provide training to employees on proper data entry procedures. Consider using data cleansing tools to identify and correct errors.
Q: What is the role of automation in operational reporting?
A: Automation can significantly improve the efficiency and accuracy of operational reporting by automating data extraction, analysis, and report generation. This frees up employees to focus on more strategic tasks.
Q: How can I make operational reports more visually appealing and easier to understand?
A: Use charts and graphs to present data in a clear and concise manner. Choose appropriate chart types for the data being presented, and use color and formatting to highlight key insights.
Q: How do I get buy-in from employees for operational reporting?
A: Communicate the benefits of operational reporting to employees and involve them in the development and implementation process. Provide training and support to help them use the reporting system effectively.
Q: How can I measure the success of my operational reporting system?
A: Track key metrics such as improved efficiency, reduced costs, and increased customer satisfaction. Monitor the usage of the reporting system and gather feedback from users to identify areas for improvement.
Q: What are some emerging trends in operational reporting?
A: Emerging trends include the use of artificial intelligence (AI) and machine learning (ML) to automate data analysis and identify hidden patterns, the increasing adoption of cloud-based reporting platforms, and the growing demand for real-time data visualization.
![]()
Leave a Reply