P1]
In the dynamic world of project management, staying organized and on track is paramount. Among the various tools available, the Gantt chart stands out as a powerful and versatile visual aid. This article delves into the intricacies of Gantt charts, exploring their history, components, benefits, creation, and best practices, providing a comprehensive understanding of how to leverage them for successful project execution.
A Brief History of the Gantt Chart
The Gantt chart, named after its inventor Henry Gantt, emerged in the early 20th century as a revolutionary method for visualizing and scheduling tasks. Gantt, a mechanical engineer and management consultant, sought to improve efficiency in industrial settings. His initial charts, developed around 1910-1915, were simpler than modern versions, focusing primarily on tracking worker performance against planned schedules. These early charts were painstakingly created by hand, requiring constant updates and modifications.
Over time, the Gantt chart evolved alongside advancements in technology. The advent of computers and project management software ushered in a new era of digital Gantt charts, offering enhanced functionality, automation, and collaboration capabilities. Today, Gantt charts are an indispensable tool for project managers across various industries, facilitating effective planning, execution, and monitoring of projects of all sizes and complexities.
Understanding the Components of a Gantt Chart
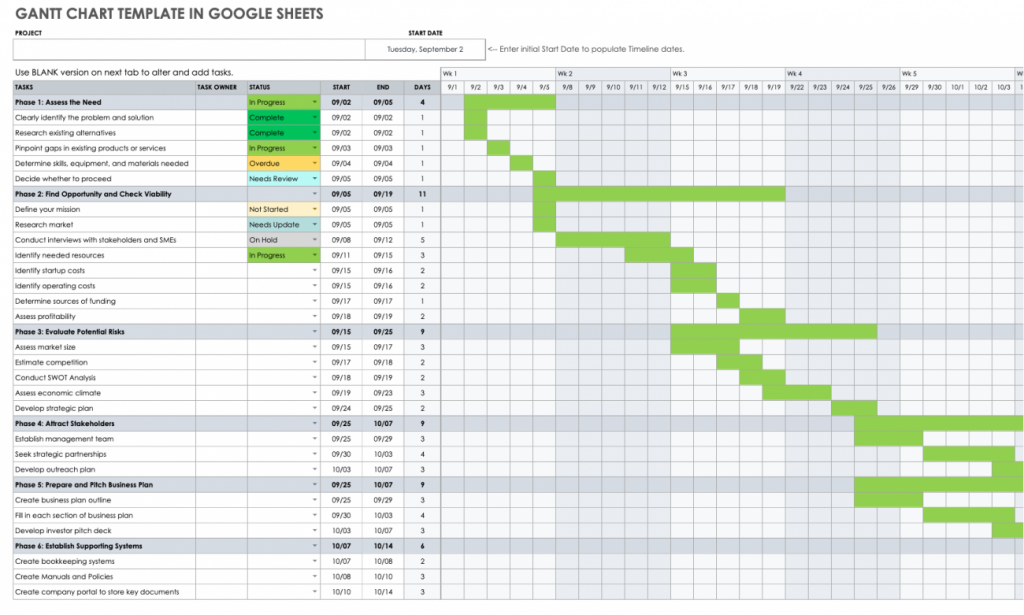
A Gantt chart, at its core, is a horizontal bar chart that visually represents a project’s schedule. Understanding its key components is crucial for effectively interpreting and utilizing the information it provides.
-
Tasks/Activities: These are the individual work items or activities that need to be completed to achieve the project’s overall goals. They are typically listed vertically on the left side of the chart. Each task should be clearly defined and have a specific deliverable.
-
Timeline: The horizontal axis of the chart represents the project’s timeline, usually measured in days, weeks, months, or even years, depending on the project’s duration. This provides a clear visual representation of the project’s schedule.
-
Bars: Each task is represented by a horizontal bar that spans the duration of that task. The length of the bar corresponds to the estimated time required to complete the task.
-
Start and End Dates: The beginning and end points of each bar indicate the start and end dates for the corresponding task. This helps to visualize the timing of each activity within the project schedule.

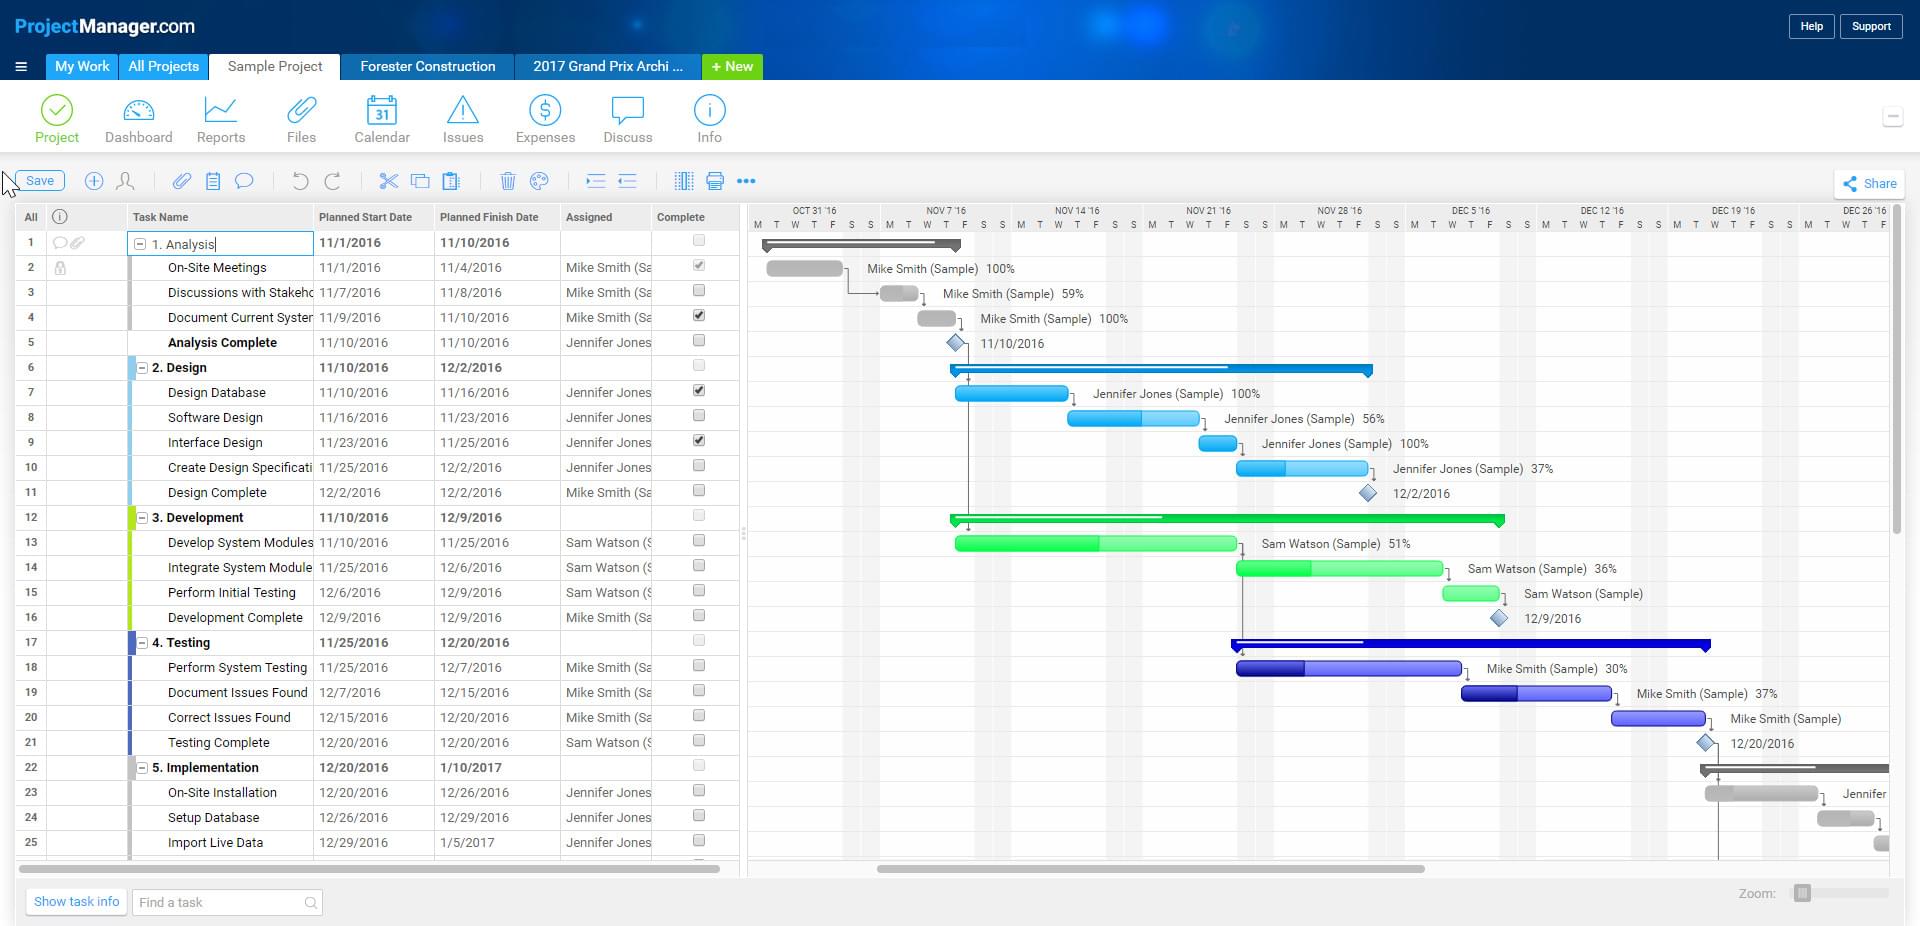
Dependencies: These represent the relationships between tasks. A dependency indicates that one task cannot begin until another task is completed. Dependencies are typically visualized using arrows connecting the bars of related tasks. Common dependency types include:
- Finish-to-Start (FS): Task B cannot start until Task A finishes.
- Start-to-Start (SS): Task B cannot start until Task A starts.
- Finish-to-Finish (FF): Task B cannot finish until Task A finishes.
- Start-to-Finish (SF): Task B cannot finish until Task A starts (less common).
-
Milestones: These are significant checkpoints or key events in the project’s schedule. They are often represented by diamond shapes and mark important achievements or deliverables.
-
Progress: Many Gantt charts include a visual representation of the progress made on each task. This can be indicated by filling the bar with a different color or shade, showing the percentage of work completed.
-
Resources: Some Gantt charts also include information about the resources assigned to each task. This can help with resource allocation and workload management.
Benefits of Using Gantt Charts
The widespread adoption of Gantt charts is a testament to their numerous benefits in project management:
-
Improved Planning and Scheduling: Gantt charts provide a clear and structured framework for planning and scheduling project tasks. They help break down complex projects into manageable activities and establish realistic timelines.
-
Enhanced Visualization: The visual nature of Gantt charts allows project teams to quickly grasp the project’s scope, schedule, and dependencies. This facilitates better understanding and communication among stakeholders.
-
Effective Resource Allocation: By visualizing resource assignments, Gantt charts help project managers allocate resources effectively and avoid over or under-allocation.
-
Dependency Management: Gantt charts highlight the dependencies between tasks, ensuring that activities are completed in the correct order and preventing delays.
-
Progress Tracking: Gantt charts enable project managers to monitor progress against the planned schedule and identify potential bottlenecks or delays.
-
Improved Communication: Gantt charts serve as a valuable communication tool, providing a shared understanding of the project’s status and progress to all stakeholders.
-
Enhanced Collaboration: Digital Gantt chart tools often facilitate collaboration among team members, allowing them to update task progress, share information, and communicate effectively.
-
Risk Management: By visualizing potential delays and dependencies, Gantt charts can help identify and mitigate potential risks to the project’s schedule.
Creating a Gantt Chart: A Step-by-Step Guide
Creating a Gantt chart involves a systematic process:
-
Define Project Scope: Clearly define the project’s objectives, deliverables, and boundaries. This provides a solid foundation for planning and scheduling.
-
Identify Tasks/Activities: Break down the project into smaller, manageable tasks and activities. Each task should be specific, measurable, achievable, relevant, and time-bound (SMART).
-
Estimate Task Durations: Estimate the time required to complete each task. Consider factors such as resource availability, complexity, and potential risks.
-
Determine Dependencies: Identify the dependencies between tasks. Determine which tasks must be completed before others can begin.
-
Assign Resources: Assign resources to each task. Consider the skills, availability, and cost of each resource.
-
Choose a Gantt Chart Tool: Select a Gantt chart tool that meets your needs. Options range from simple spreadsheet templates to sophisticated project management software.
-
Create the Chart: Input the tasks, durations, dependencies, and resource assignments into the chosen tool.
-
Visualize the Schedule: The tool will automatically generate the Gantt chart, visually representing the project’s schedule.
-
Review and Refine: Review the Gantt chart with the project team and stakeholders. Make any necessary adjustments to ensure the schedule is realistic and achievable.
-
Update and Monitor: Regularly update the Gantt chart as the project progresses. Track progress against the planned schedule and make adjustments as needed.
Best Practices for Using Gantt Charts
To maximize the effectiveness of Gantt charts, consider these best practices:
-
Keep it Simple: Avoid overcrowding the chart with too much information. Focus on the key tasks, dependencies, and milestones.
-
Use Clear and Concise Language: Use clear and concise language to describe tasks and dependencies.
-
Involve the Team: Involve the project team in the creation and maintenance of the Gantt chart. This fosters ownership and commitment.
-
Regularly Update the Chart: Keep the Gantt chart up-to-date to reflect the project’s current status.
-
Communicate Effectively: Use the Gantt chart to communicate the project’s schedule and progress to all stakeholders.
-
Be Flexible: Be prepared to adjust the Gantt chart as needed to accommodate changes in the project’s scope, schedule, or resources.
-
Use Color Coding: Utilize color coding to visually differentiate tasks, resources, or progress.
-
Consider Critical Path Analysis: Identify the critical path, which is the sequence of tasks that directly affects the project’s completion date. Focus on managing these tasks closely.
Popular Gantt Chart Software Options
Numerous software options cater to diverse needs and budgets:
- Microsoft Project: A robust and comprehensive project management tool.
- Asana: A popular project management platform with excellent collaboration features.
- Trello: A visually intuitive Kanban-style board that can be adapted for Gantt chart functionality.
- Wrike: A powerful project management tool with advanced reporting and analytics.
- TeamGantt: A user-friendly, web-based Gantt chart tool.
- Smartsheet: A spreadsheet-based project management tool with Gantt chart capabilities.
- GanttProject: A free and open-source desktop application for creating Gantt charts.
FAQ: Frequently Asked Questions About Gantt Charts
-
What is the difference between a Gantt chart and a PERT chart? While both are project scheduling tools, Gantt charts focus on visualizing the timeline of tasks, while PERT charts emphasize the dependencies between tasks and use probabilistic estimates for task durations.
-
Can I use a Gantt chart for personal projects? Absolutely! Gantt charts can be incredibly helpful for organizing and managing personal projects, such as home renovations, event planning, or writing a book.
-
How often should I update my Gantt chart? The frequency of updates depends on the project’s complexity and pace. For fast-moving projects, daily or weekly updates may be necessary. For longer-term projects, bi-weekly or monthly updates may suffice.
-
What if a task takes longer than expected? If a task is delayed, update the Gantt chart to reflect the new completion date. Assess the impact on subsequent tasks and the overall project schedule. Consider adjusting resources or scope to mitigate the delay.
-
Are there any limitations to using Gantt charts? Gantt charts can become complex and difficult to manage for very large or intricate projects. They also may not be suitable for projects with highly uncertain or unpredictable task durations.
-
Can I export my Gantt chart to share with others? Most Gantt chart software allows you to export the chart in various formats, such as PDF, image, or spreadsheet, making it easy to share with stakeholders.
Conclusion: Empowering Project Success with Gantt Charts
Gantt charts have evolved from simple hand-drawn diagrams to sophisticated digital tools, but their core purpose remains the same: to provide a clear and visual representation of a project’s schedule. By understanding the components, benefits, and best practices associated with Gantt charts, project managers can leverage this powerful tool to improve planning, execution, and monitoring, ultimately leading to greater project success. Whether you’re managing a small personal project or a large-scale enterprise initiative, mastering the art of Gantt charting is a valuable skill that can significantly enhance your project management capabilities. So, embrace the power of visualization and unlock the potential of Gantt charts to bring your projects to fruition, on time and within budget.

Leave a Reply