P1]Graphs/”>Line-graphs/”>Guide-to-line-graphs/”>Comprehensive-guide-to-line-graphs/”>Data-dance-a-comprehensive-guide-to-line-graphs/”>Decoding-the-Data-Dance.jpg” alt=”Decoding the Data Dance: A Comprehensive Guide to Line Graphs” />
Line graphs, often overlooked in the dazzling world of data visualization, are workhorses of analytical communication. Their simplicity belies their power – they can elegantly illustrate trends, highlight patterns, and convey complex information with remarkable clarity. Understanding how to interpret and construct line graphs is a fundamental skill for anyone navigating the data-rich landscape of modern life. This article provides a comprehensive guide to line graphs, exploring their purpose, construction, interpretation, common pitfalls, and applications.
What is a Line Graph?
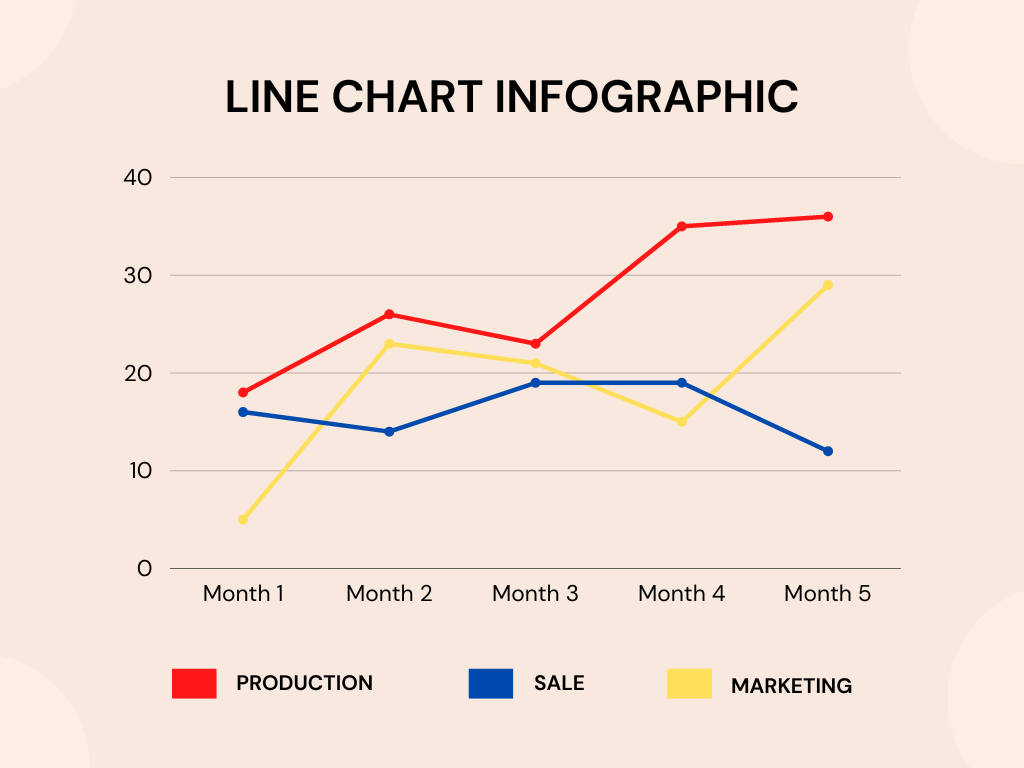
At its core, a line graph (also known as a line chart) is a type of chart that displays information as a series of data points connected by straight line segments. It presents quantitative data over a specific period or range, allowing viewers to easily visualize how a variable changes over time or in relation to another variable.
The key components of a line graph are:
- Axes: Typically, the horizontal axis (x-axis) represents the independent variable, often time (days, months, years), but it can also represent other continuous variables. The vertical axis (y-axis) represents the dependent variable, the quantity being measured.
- Data Points: These are the individual measurements or values collected at specific intervals. They are plotted on the graph based on their corresponding x and y values.
- Lines: Straight lines connect the data points, visually representing the trend or relationship between the variables. The slope of the line indicates the rate of change – a steeper slope indicates a faster rate of change.
- **


Leave a Reply