P1]
In the realm of data science, where information explodes in volume and complexity, the ability to extract meaningful insights becomes paramount. Among the powerful tools available to data scientists, cluster analysis stands out as a versatile and insightful technique. It allows us to group similar data points together, revealing underlying patterns and structures that might otherwise remain hidden within the noise. This article delves into the core concepts of cluster analysis, exploring its methodologies, applications, challenges, and practical considerations.
What is Cluster Analysis?
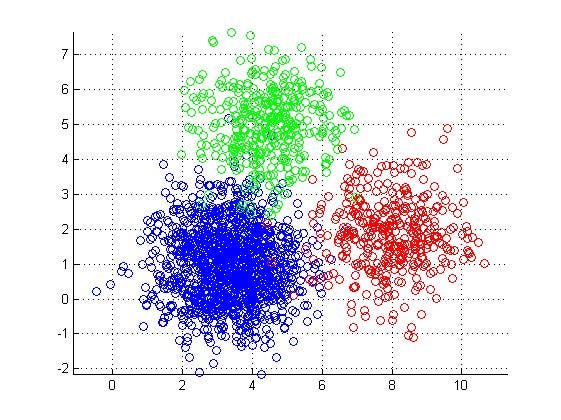
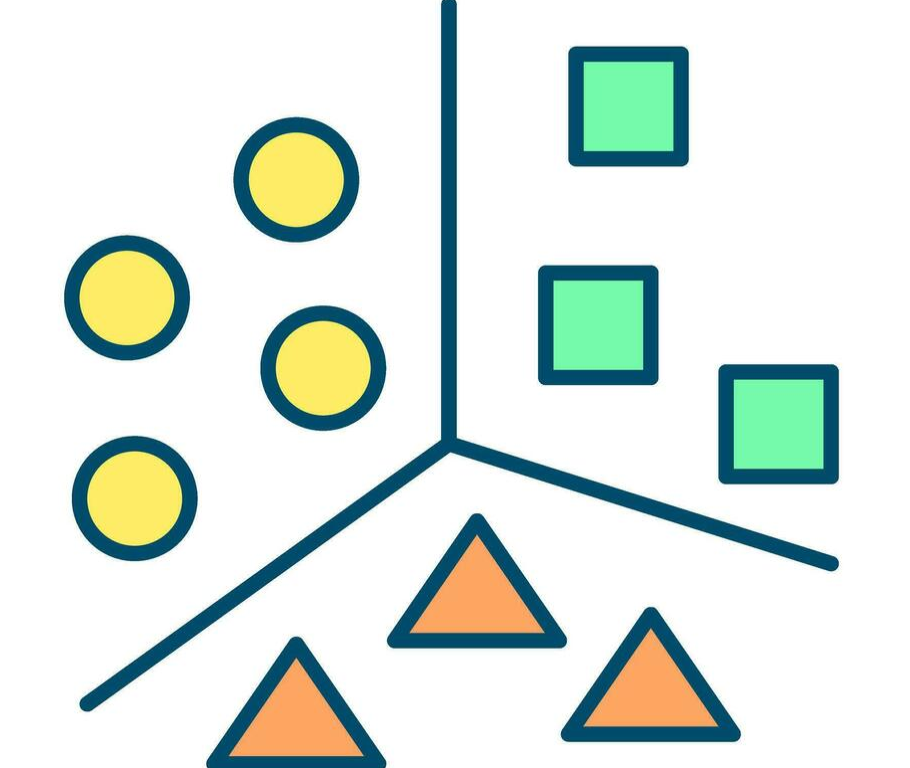
At its core, cluster analysis, also known as clustering, is an unsupervised learning technique that aims to partition a dataset into distinct groups, or clusters, such that data points within the same cluster are more similar to each other than to those in other clusters. Unlike supervised learning, which relies on labeled data, cluster analysis operates on unlabeled data, discovering inherent groupings based on the intrinsic characteristics of the data points. Think of it as automatically sorting a pile of mixed objects into separate containers based on their shared features.
Key Concepts and Terminology:
- Data Points: These are the individual items or observations being analyzed. They can represent anything from customers in a marketing database to genes in a biological experiment.
- Features/Attributes: These are the characteristics or properties of each data point used to determine similarity. For example, in customer segmentation, features might include age, income, and purchase history.
- Distance/Similarity Measures: These metrics quantify the similarity or dissimilarity between data points. Common measures include:
- Euclidean Distance: The straight-line distance between two points. Suitable for continuous numerical data.
- Manhattan Distance: The sum of the absolute differences between coordinates. Also suitable for continuous numerical data, but less sensitive to outliers.
- Cosine Similarity: Measures the cosine of the angle between two vectors, representing the similarity in direction. Often used for text data and high-dimensional data.
- Correlation: Measures the statistical relationship between two variables. Useful for identifying patterns in time series data.

- Centroid: The representative point of a cluster, often calculated as the mean or median of all data points within the cluster.
- Cluster Density: A measure of how closely packed the data points are within a cluster.
- Cluster Separation: A measure of how distinct the clusters are from each other.

Common Clustering Algorithms:
Several algorithms exist for performing cluster analysis, each with its strengths and weaknesses. Here are some of the most widely used:

- K-Means Clustering: This algorithm aims to partition the data into k clusters, where k is a pre-defined number. It iteratively assigns each data point to the nearest cluster centroid and then recalculates the centroids based on the new cluster assignments. K-Means is computationally efficient and easy to implement, but it is sensitive to the initial placement of centroids and assumes that clusters are spherical and equally sized.
- Hierarchical Clustering: This approach builds a hierarchy of clusters, either by starting with each data point as its own cluster and iteratively merging the closest clusters (agglomerative clustering) or by starting with a single cluster containing all data points and iteratively splitting it into smaller clusters (divisive clustering). Hierarchical clustering provides a visual representation of the cluster structure in the form of a dendrogram and doesn’t require specifying the number of clusters in advance. However, it can be computationally expensive for large datasets.
- DBSCAN (Density-Based Spatial Clustering of Applications with Noise): This algorithm identifies clusters based on the density of data points. It groups together data points that are closely packed together, marking as outliers data points that lie alone in low-density regions. DBSCAN is robust to noise and can discover clusters of arbitrary shapes, but it requires careful tuning of its parameters (epsilon and minimum points).
- Mean Shift Clustering: This algorithm iteratively shifts data points towards the modes of the data distribution, forming clusters around these modes. It doesn’t require specifying the number of clusters in advance and can discover clusters of arbitrary shapes. However, it can be computationally expensive for high-dimensional data.
- Gaussian Mixture Models (GMMs): This probabilistic approach assumes that the data is generated from a mixture of Gaussian distributions. It uses the Expectation-Maximization (EM) algorithm to estimate the parameters of each Gaussian component and assigns data points to clusters based on their probabilities of belonging to each component. GMMs are flexible and can model clusters with different shapes and sizes, but they can be sensitive to initialization and require more computational resources than K-Means.
The Clustering Process: A Step-by-Step Guide:
- Data Preparation: This crucial step involves cleaning, transforming, and pre-processing the data to ensure its quality and suitability for clustering. This may include handling missing values, removing outliers, scaling or normalizing features, and selecting relevant features.
- Feature Selection/Extraction: Choosing the right features is critical for effective clustering. Feature selection involves selecting a subset of the original features that are most relevant for distinguishing between clusters. Feature extraction involves transforming the original features into a new set of features that capture the essential information in a more compact and informative way. Techniques like Principal Component Analysis (PCA) can be used for feature extraction.
- Algorithm Selection: The choice of clustering algorithm depends on the characteristics of the data, the desired cluster structure, and the computational resources available. Consider factors such as the shape and size of the clusters, the presence of noise, and the scalability of the algorithm.
- Parameter Tuning: Most clustering algorithms have parameters that need to be tuned to optimize their performance. For example, K-Means requires specifying the number of clusters (k), while DBSCAN requires specifying the epsilon and minimum points parameters. Techniques like the elbow method or silhouette analysis can be used to guide parameter tuning.
- Clustering Execution: Once the data is prepared, the features are selected, and the algorithm is chosen and tuned, the clustering algorithm is executed on the data.
- Cluster Evaluation: Evaluating the quality of the resulting clusters is essential to ensure that the clustering is meaningful and useful. This can be done using various metrics, such as:
- Silhouette Score: Measures how similar each data point is to its own cluster compared to other clusters. A higher silhouette score indicates better clustering.
- Davies-Bouldin Index: Measures the average similarity between each cluster and its most similar cluster. A lower Davies-Bouldin index indicates better clustering.
- Calinski-Harabasz Index: Measures the ratio of between-cluster variance to within-cluster variance. A higher Calinski-Harabasz index indicates better clustering.
- Interpretation and Validation: The final step involves interpreting the meaning of the clusters and validating the results. This may involve examining the characteristics of the data points within each cluster, comparing the clusters to external knowledge or domain expertise, and performing statistical tests to assess the significance of the clustering.
Applications of Cluster Analysis:
Cluster analysis finds applications in a wide range of fields, including:
- Marketing: Customer segmentation, identifying customer groups with similar buying habits and preferences.
- Biology: Gene expression analysis, grouping genes with similar expression patterns.
- Finance: Fraud detection, identifying unusual patterns of financial transactions.
- Image Processing: Image segmentation, grouping pixels with similar colors or textures.
- Recommender Systems: Grouping users with similar preferences to provide personalized recommendations.
- Social Network Analysis: Identifying communities or groups of users with similar interests or connections.
Challenges and Considerations:
- Choosing the Right Algorithm: The best clustering algorithm depends on the specific dataset and the goals of the analysis. Experimentation and careful consideration are necessary.
- Determining the Number of Clusters: Selecting the optimal number of clusters can be challenging. Techniques like the elbow method, silhouette analysis, and domain expertise can help.
- Dealing with High-Dimensional Data: Clustering high-dimensional data can be computationally expensive and challenging due to the curse of dimensionality. Feature selection and dimensionality reduction techniques can help.
- Handling Noise and Outliers: Noise and outliers can significantly affect the results of clustering. Robust clustering algorithms and outlier detection techniques can mitigate these effects.
- Interpreting the Results: Interpreting the meaning of the clusters and validating the results requires domain expertise and careful analysis.
Conclusion:
Cluster analysis is a powerful and versatile technique for uncovering hidden patterns and structures in data. By grouping similar data points together, it provides valuable insights that can be used to inform decision-making in a wide range of fields. While challenges exist in selecting the right algorithm, tuning parameters, and interpreting results, the benefits of cluster analysis make it an indispensable tool for data scientists and analysts seeking to extract meaningful information from complex datasets. By carefully considering the principles and techniques outlined in this article, practitioners can effectively leverage cluster analysis to gain a deeper understanding of their data and unlock its full potential.
FAQ: Cluster Analysis
Q: What is the difference between cluster analysis and classification?
A: Classification is a supervised learning technique that requires labeled data to train a model that can predict the class of new data points. Cluster analysis, on the other hand, is an unsupervised learning technique that operates on unlabeled data to discover inherent groupings or clusters.
Q: How do I choose the right clustering algorithm?
A: The best clustering algorithm depends on the characteristics of your data, the desired cluster structure, and the computational resources available. Consider factors such as the shape and size of the clusters, the presence of noise, and the scalability of the algorithm. Experiment with different algorithms and evaluate their performance using appropriate metrics.
Q: How do I determine the optimal number of clusters?
A: There is no single "best" method for determining the optimal number of clusters. Common techniques include the elbow method, silhouette analysis, the gap statistic, and the Calinski-Harabasz index. Domain expertise and business context should also be considered.
Q: What are some common distance/similarity measures used in cluster analysis?
A: Common distance/similarity measures include Euclidean distance, Manhattan distance, cosine similarity, correlation, and Jaccard index. The choice of measure depends on the type of data and the specific application.
Q: How do I handle missing values in my data before clustering?
A: There are several ways to handle missing values, including:
- Deletion: Removing data points or features with missing values.
- Imputation: Replacing missing values with estimated values, such as the mean, median, or mode.
- Model-based imputation: Using machine learning models to predict missing values.
Q: How do I deal with outliers in my data before clustering?
A: Outliers can significantly affect the results of clustering. You can use outlier detection techniques, such as box plots, scatter plots, or statistical methods, to identify and remove or transform outliers. Robust clustering algorithms like DBSCAN are also less sensitive to outliers.
Q: What is the "curse of dimensionality" in the context of cluster analysis?
A: The "curse of dimensionality" refers to the challenges that arise when dealing with high-dimensional data. As the number of features increases, the data becomes more sparse, and the distance between data points tends to become more uniform, making it difficult to distinguish between clusters.
Q: How can I evaluate the quality of my clustering results?
A: You can evaluate the quality of your clustering results using various metrics, such as the silhouette score, Davies-Bouldin index, Calinski-Harabasz index, and visual inspection of the clusters. Also, consider whether the clusters are meaningful and interpretable in the context of your application.
Q: Is cluster analysis suitable for all types of data?
A: Cluster analysis is generally suitable for numerical data, but it can also be applied to categorical data with appropriate modifications. For example, you can use one-hot encoding to convert categorical variables into numerical features. However, the choice of distance/similarity measure should be carefully considered for categorical data.
Q: What software packages can I use for cluster analysis?
A: Many software packages are available for cluster analysis, including:
- R: A popular statistical programming language with extensive clustering libraries.
- Python: A versatile programming language with libraries like scikit-learn, scipy, and pandas for cluster analysis.
- MATLAB: A numerical computing environment with built-in clustering functions.
- SAS: A statistical software suite with a comprehensive set of clustering tools.
- SPSS: A statistical software package with user-friendly clustering interfaces.
Leave a Reply